
How to cite us / Summary / Code / Dataset / Results
Official website of:
- E. Fanì, M. Ciccone, B. Caputo. FedDrive v2: an Analysis of the Impact of Label Skewness in Federated Semantic Segmentation for Autonomous Driving. 5th Italian Conference on Robotics and Intelligent Machines (I-RIM), 2023.
- L. Fantauzzo*, E. Fanì*, D. Caldarola, A. Tavera, F. Cermelli1, M. Ciccone, B. Caputo. FedDrive: Generalizing Federated Learning to Semantic Segmentation in Autonomous Driving, IEEE/RSJ International Conference on Intelligent Robots and Systems, 2022.
Corresponding author: eros.fani@polito.it.
All the authors are supported by Politecnico di Torino, Turin, Italy.
*Equal contribution. 1Fabio Cermelli is with Italian Institute of Technology, Genoa, Italy.
Citation
If you find our work relevant to your research or use our code, please cite our papers:
@inproceedings{feddrive2023,
  title={FedDrive v2: an Analysis of the Impact of Label Skewness in Federated Semantic Segmentation for Autonomous Driving},
  author={Fanì, Eros and Ciccone, Marco and Caputo, Barbara},
  journal={5th Italian Conference on Robotics and Intelligent Machines (I-RIM)},
  year={2023}
}

@inproceedings{feddrive2022,
  title={FedDrive: Generalizing Federated Learning to Semantic Segmentation in Autonomous Driving},
  author={Fantauzzo, Lidia and Fanì, Eros and Caldarola, Debora and Tavera, Antonio and Cermelli, Fabio and Ciccone, Marco and Caputo, Barbara},
  booktitle={Proceedings of the 2022 IEEE/RSJ International Conference on Intelligent Robots and Systems},
  year={2022}
}
Summary
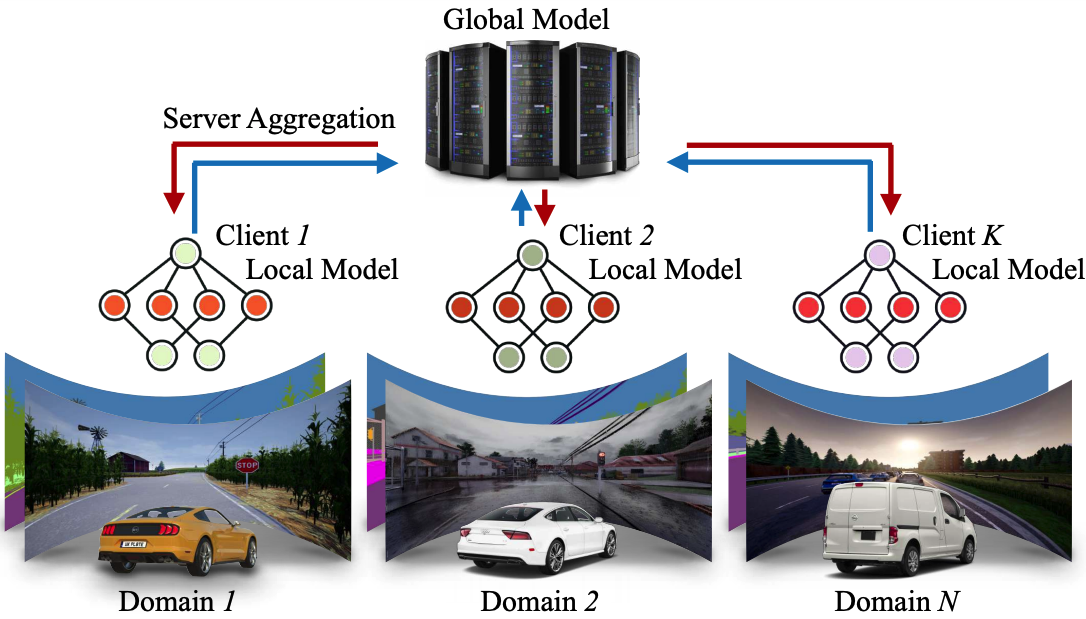
FedDrive is a new benchmark for the Semantic Segmentation task in a Federated Learning scenario for autonomous driving.
It consists of 12 distinct scenarios, incorporating the real-world challenges of statistical heterogeneity and domain generalization. FedDrive incorporates algorithms and style transfer methods from Federated Learning, Domain Generalization, and Domain Adaptation literature. Its main goal is to enhance model generalization and robustness against statistical heterogeneity.
We show the importance of using the correct clients’ statistics when dealing with different domains and label skewness and how style transfer techniques can improve the performance on unseen domains, proving FedDrive to be a solid baseline for future research in federated semantic segmentation.
| Dataset | Setting | Distribution | # Clients | # img/cl | Test clients |
|---|---|---|---|---|---|
| Cityscapes | - | Uniform, Heterogeneous, Class Imbalance | 146 | 10-45 | unseen cities |
| IDDA | Country | Uniform, Heterogeneous, Class Imbalance | 90 | 48 | seen + unseen (country) domains |
| Rainy | Uniform, Heterogeneous, Class Imbalance | 69 | 48 | seen + unseen (rainy) domains | |
| Bus | Uniform, Heterogeneous, Class Imbalance | 83 | 48 | seen + unseen (bus) domains |
Source code
Python code based on PyTorch is open-source and available on GitHub.
Download of the datasets
Download the Cityscapes dataset from here.
You may need a new account if you do not have one yet. Download the gtFine_trainvaltest.zip and leftImg8bit_trainvaltest.ziparchives.
Ask for the IDDA V3 version of IDDA, available here.
You can find all the 12 scenarios in the data directory of our
official repository.
Results
Cityscapes
| Distribution | Method | CFSI | LAB | mIoU ± std (%) |
|---|---|---|---|---|
| Uniform | FedAvg | ✗ | ✗ | 45.62 ± 1.25 |
| Heterogeneous | FedAvg | ✗ | ✗ | 43.33 ± 1.66 |
| ✓ | ✗ | 40.55 ± 2.15 | ||
| ✗ | ✓ | 42.69 ± 2.07 | ||
| SiloBN | ✗ | ✗ | 52.86 ± 1.29 | |
| ✓ | ✗ | 52.11 ± 1.83 | ||
| ✗ | ✓ | 53.37 ± 1.65 | ||
| Class Imbalance | FedAvg | ✗ | ✗ | 44.48 ± 1.70 |
| ✓ | ✗ | 48.28 ± 1.83 | ||
| ✗ | ✓ | 44.34 ± 1.73 | ||
| SiloBN | ✗ | ✗ | 51.78 ± 1.15 | |
| ✓ | ✗ | 50.82 ± 1.08 | ||
| ✗ | ✓ | 51.48 ± 1.22 |
IDDA
FedAvg experiments
Results are expressed as mIoU ± std (%).
| Distribution | Setting | CFSI | LAB | Unseen | Seen |
|---|---|---|---|---|---|
| Uniform | Country | ✗ | ✗ | 49.74 ± 0.79 | 63.57 ± 0.60 |
| Rainy | ✗ | ✗ | 27.61 ± 2.80 | 62.72 ± 3.65 | |
| Bus | ✗ | ✗ | 58.51 ± 1.32 | 64.87 ± 0.65 | |
| Heterogeneous | Country | ✗ | ✗ | 40.01 ± 1.26 | 42.43 ± 1.78 |
| ✓ | ✗ | 45.70 ± 1.73 | 54.70 ± 1.12 | ||
| ✗ | ✓ | 45.68 ± 1.04 | 56.59 ± 0.90 | ||
| Rainy | ✗ | ✗ | 26.75 ± 2.32 | 38.18 ± 1.40 | |
| ✓ | ✗ | 31.05 ± 2.68 | 55.24 ± 1.65 | ||
| ✗ | ✓ | 26.82 ± 1.78 | 58.85 ± 0.89 | ||
| Bus | ✗ | ✗ | 38.13 ± 1.96 | 45.71 ± 1.65 | |
| ✓ | ✗ | 48.88 ± 1.46 | 56.93 ± 1.39 | ||
| ✗ | ✓ | 50.48 ± 1.09 | 58.84 ± 0.97 | ||
| Class Imbalance | Country | ✗ | ✗ | 47.58 ± 0.69 | 58.09 ± 0.78 |
| ✓ | ✗ | 48.69 ± 0.82 | 59.67 ± 0.88 | ||
| ✗ | ✓ | 48.91 ± 0.78 | 60.07 ± 1.18 | ||
| Rainy | ✗ | ✗ | 29.46 ± 1.90 | 58.75 ± 1.45 | |
| ✓ | ✗ | 25.69 ± 2.77 | 60.37 ± 0.60 | ||
| ✗ | ✓ | 29.11 ± 1.68 | 61.22 ± 0.98 | ||
| Bus | ✗ | ✗ | 53.29 ± 2.05 | 60.47 ± 1.75 | |
| ✓ | ✗ | 52.91 ± 1.33 | 61.24 ± 1.24 | ||
| ✗ | ✓ | 54.01 ± 1.15 | 62.10 ± 0.55 |
SiloBN experiments
| Setting | CFSI | LAB | Unseen | Seen | |
|---|---|---|---|---|---|
| Standard | By Domain | ||||
| Country | ✗ | ✗ | 45.32 ± 0.90 | 54.46 ± 0.72 | 58.82 ± 2.93 |
| ✓ | ✗ | 49.17 ± 1.01 | 63.43 ± 0.58 | 61.22 ± 3.88 | |
| ✗ | ✓ | 50.43 ± 0.63 | 64.59 ± 0.45 | 64.32 ± 0.76 | |
| Rainy | ✗ | ✗ | 50.03 ± 0.79 | 54.36 ± 0.83 | 62.48 ± 1.42 |
| ✓ | ✗ | 50.54 ± 0.88 | 64.85 ± 0.72 | 63.04 ± 0.31 | |
| ✗ | ✓ | 53.99 ± 0.79 | 65.90 ± 0.55 | 65.85 ± 0.91 | |
| Bus | ✗ | ✗ | 47.37 ± 0.80 | 57.84 ± 0.89 | 61.56 ± 1.39 |
| ✓ | ✗ | 55.84 ± 0.99 | 65.78 ± 0.81 | 64.03 ± 2.68 | |
| ✗ | ✓ | 56.23 ± 0.64 | 66.98 ± 0.34 | 66.23 ± 0.83 | |
| Setting | CFSI | LAB | Unseen | Seen |
|---|---|---|---|---|
| Country | ✗ | ✗ | 51.19 ± 0.55 | 66.46 ± 0.35 |
| ✓ | ✗ | 51.73 ± 0.69 | 67.22 ± 0.41 | |
| ✗ | ✓ | 53.10 ± 0.55 | 67.33 ± 0.36 | |
| Rainy | ✗ | ✗ | 54.68 ± 0.56 | 66.41 ± 0.53 |
| ✓ | ✗ | 54.35 ± 1.03 | 67.07 ± 0.39 | |
| ✗ | ✓ | 52.91 ± 0.84 | 67.63 ± 0.32 | |
| Bus | ✗ | ✗ | 57.63 ± 0.59 | 67.54 ± 0.41 |
| ✓ | ✗ | 57.68 ± 0.66 | 67.89 ± 0.59 | |
| ✗ | ✓ | 58.02 ± 0.55 | 67.80 ± 0.43 |
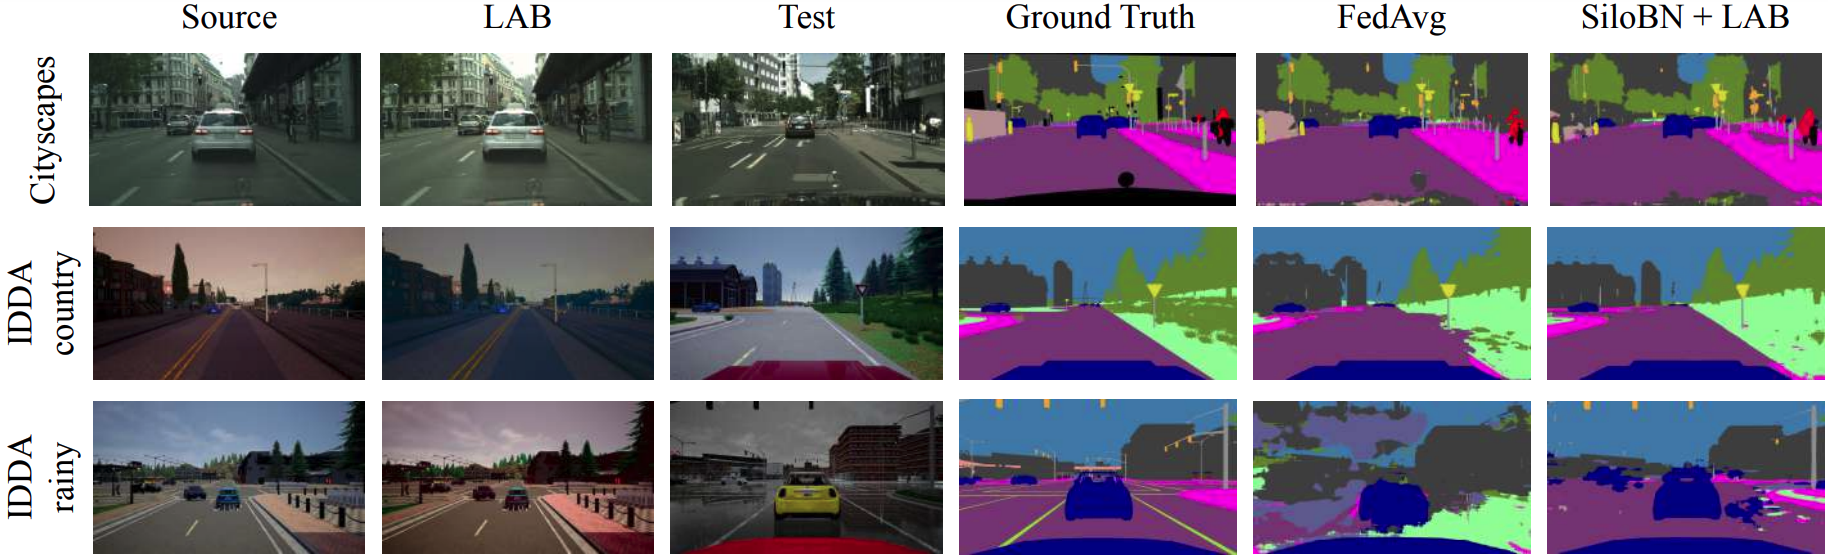
Qualitative results
Server optimizers comparison on IDDA
| Distribution | Setting | SGD | FedAvgM | Adam | AdaGrad | ||||
|---|---|---|---|---|---|---|---|---|---|
| Unseen | Seen | Unseen | Seen | Unseen | Seen | Unseen | Seen | ||
| Uniform | Country | 49.74 ± 0.79 | 63.57 ± 0.60 | 55.47 ± 1.07 | 71.27 ± 0.85 | 50.21 ± 0.40 | 63.31 ± 0.37 | 46.09 ± 0.83 | 59.44 ± 0.94 |
| Rainy | 27.61 ± 2.80 | 62.72 ± 3.65 | 29.83 ± 2.03 | 70.99 ± 0.71 | 31.72 ± 1.74 | 65.39 ± 0.52 | 27.80 ± 1.29 | 59.45 ± 1.30 | |
| Bus | 58.51 ± 1.32 | 64.87 ± 0.65 | 62.32 ± 1.25 | 71.76 ± 0.37 | 58.57 ± 0.43 | 64.77 ± 0.38 | 53.96 ± 1.21 | 61.19 ± 0.96 | |
| Heterogeneous | Country | 40.01 ± 1.26 | 42.43 ± 1.78 | 42.42 ± 2.15 | 44.38 ± 1.98 | 38.15 ± 1.89 | 39.93 ± 2.44 | 38.03 ± 1.65 | 40.89 ± 2.05 |
| Rainy | 26.75 ± 2.32 | 38.18 ± 1.40 | 31.91 ± 3.77 | 41.21 ± 1.98 | 28.47 ± 2.56 | 37.97 ± 2.04 | 27.08 ± 2.85 | 39.02 ± 1.71 | |
| Bus | 38.13 ± 1.96 | 45.71 ± 1.65 | 40.39 ± 1.56 | 48.92 ± 1.54 | 38.88 ± 1.35 | 45.15 ± 1.11 | 37.21 ± 1.60 | 44.51 ± 1.34 | |
| Class Imbalance | Country | 47.58 ± 0.69 | 58.09 ± 0.78 | 50.22 ± 1.17 | 63.01 ± 1.20 | 47.38 ± 0.58 | 58.98 ± 0.66 | 44.64 ± 1.29 | 55.50 ± 0.97 |
| Rainy | 29.46 ± 1.90 | 58.75 ± 1.45 | 32.30 ± 1.93 | 63.96 ± 1.11 | 35.78 ± 1.93 | 57.50 ± 1.17 | 29.31 ± 1.22 | 55.87 ± 1.87 | |
| Bus | 53.29 ± 2.05 | 60.47 ± 1.75 | 54.71 ± 1.65 | 64.45 ± 1.00 | 53.13 ± 0.71 | 60.97 ± 0.69 | 48.95 ± 1.48 | 57.57 ± 1.37 | |
| Setting | Optimizer | Unseen | Seen | |
|---|---|---|---|---|
| Standard | By Domain | |||
| Country | SGD | 45.32 ± 0.90 | 54.46 ± 0.72 | 58.82 ± 2.93 |
| FedAvgM | 46.20 ± 1.20 | 54.56 ± 1.29 | 61.99 ± 1.51 | |
| Adam | 42.31 ± 0.84 | 52.46 ± 0.83 | 58.36 ± 1.26 | |
| AdaGrad | 41.69 ± 1.31 | 51.35 ± 0.95 | 48.97 ± 1.34 | |
| Rainy | SGD | 50.03 ± 0.79 | 54.36 ± 0.83 | 62.48 ± 1.42 |
| FedAvgM | 48.49 ± 1.04 | 51.71 ± 0.73 | 63.69 ± 1.25 | |
| Adam | 47.22 ± 0.89 | 50.88 ± 0.51 | 61.51 ± 0.90 | |
| AdaGrad | 45.80 ± 0.89 | 48.48 ± 0.83 | 54.06 ± 1.29 | |
| Bus | SGD | 47.37 ± 0.80 | 57.84 ± 0.89 | 61.56 ± 1.39 |
| FedAvgM | 46.91 ± 1.04 | 55.98 ± 0.76 | 63.41 ± 1.43 | |